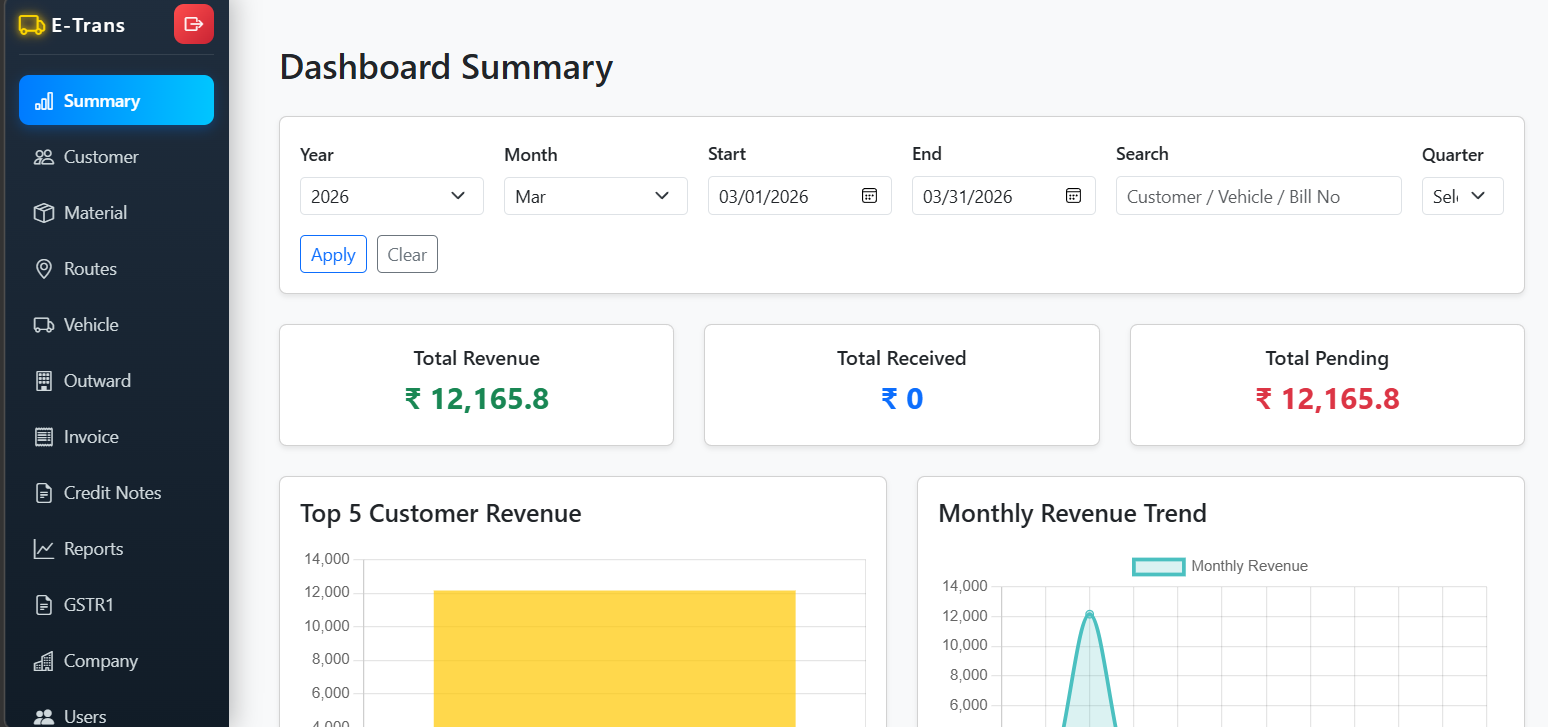
Dashboard Summary Module
The Dashboard Summary Module provides a high-level overview of financials and operations. It allows users to filter, search, visualize, and drill down into invoices, revenue, and vehicle/customer performance.
🔹 Features
1. Filters
- Year & Month: Filter data by specific year and/or month.
- Quarter: Select quarter to automatically set start and end dates.
- Start & End Dates: Override period selection with custom dates.
- Search: Search by Customer, Vehicle, or Bill No with auto-suggestions.
- Apply/Clear Buttons: Apply filters dynamically or reset to default (current month).
2. Summary Cards
- Total Revenue: Total revenue generated in selected period.
- Total Received: Total payments received.
- Total Pending: Outstanding balances.
3. Charts
- Top 5 Customer Revenue: Bar chart highlighting highest revenue-generating customers.
- Monthly Revenue Trend: Line chart showing revenue across months.
- Pending vs Received: Stacked bar chart comparing received vs pending amounts per customer.
- Vehicle Revenue: Bar chart showing revenue per vehicle.
4. Paginated Invoice Table
- Displays Bill No, Customer, Vehicle(s), Total Amount, Received, Balance.
- Pagination supports navigating multiple pages of bills.
5. Loading State
- Shows a spinner while fetching data or performing API requests.
🔗 API Endpoints
| Action | Method | Endpoint | Description |
|---|---|---|---|
| Fetch Dashboard Summary | GET | /dashboard/summary |
Returns totals, charts, and paginated invoices |
| Fetch Search Suggestions | GET | /dashboard/suggestions |
Returns autocomplete suggestions for search input |
📝 Workflow
- Load Dashboard:
- Default selection: Current Year and Month.
- Fetches summary, charts, and paginated invoices.
- Filtering:
- Change year, month, or quarter → updates start/end dates automatically.
- Custom start/end date overrides period filters.
- Search updates suggestions dynamically and filters results.
- Charts Rendering:
- Customer, monthly, pending vs received, and vehicle revenue charts render dynamically using Chart.js.
- Top 5 customers highlighted with color coding based on revenue.
- Pagination:
- Navigate invoices using previous/next buttons or page numbers.
- Clear Filters:
- Resets all filters to current month and clears search input.
⚡ UI / UX Notes
- Responsive Filters: Single-row, flexible layout for desktop and mobile.
- Autocomplete: Provides keyboard navigation and mouse selection for suggestions.
- Stacked Bars: Pending vs Received chart shows comparative metrics clearly.
- Color-Coding:
- Green for high revenue
- Yellow for moderate
- Red for low revenue
- Charts are interactive with tooltips displaying formatted currency values.
🔹 Data Mapping
| Component | Source Data |
|---|---|
| Total Revenue | res.data.totalRevenue |
| Total Received | res.data.totalReceived |
| Total Pending | res.data.totalPending |
| Customer Revenue | res.data.customerRevenue |
| Vehicle Revenue | res.data.vehicleRevenue |
| Bills Table | res.data.bills |
📷 Screenshot (Example)